만들려는 것은, 원둘레까지의 막대를 이용해서, 사인파가 계속해서 그려지면서 왼쪽 편으로 흐르듯이 진행되는 애니메이션이다.

그냥 0 ~ 2 $\pi$까지 등 일정 범위에 대해 사인 파형을 그리는 것은 여기 코드를 참조.
원 막대 없이 그냥 사인파가 흐르는 애니메이션은 여기 참조.
기본 구상
먼저 일정 구간에 대한 사인파를 그리고, 그 사인파의 끝 지점을 원 막대에서 연장된 라인이 가리키게 한 후, 막대가 회전함에 따라 사인파를 계속 업데이트해서 마치 흐르는 것처럼 만든다.
코딩
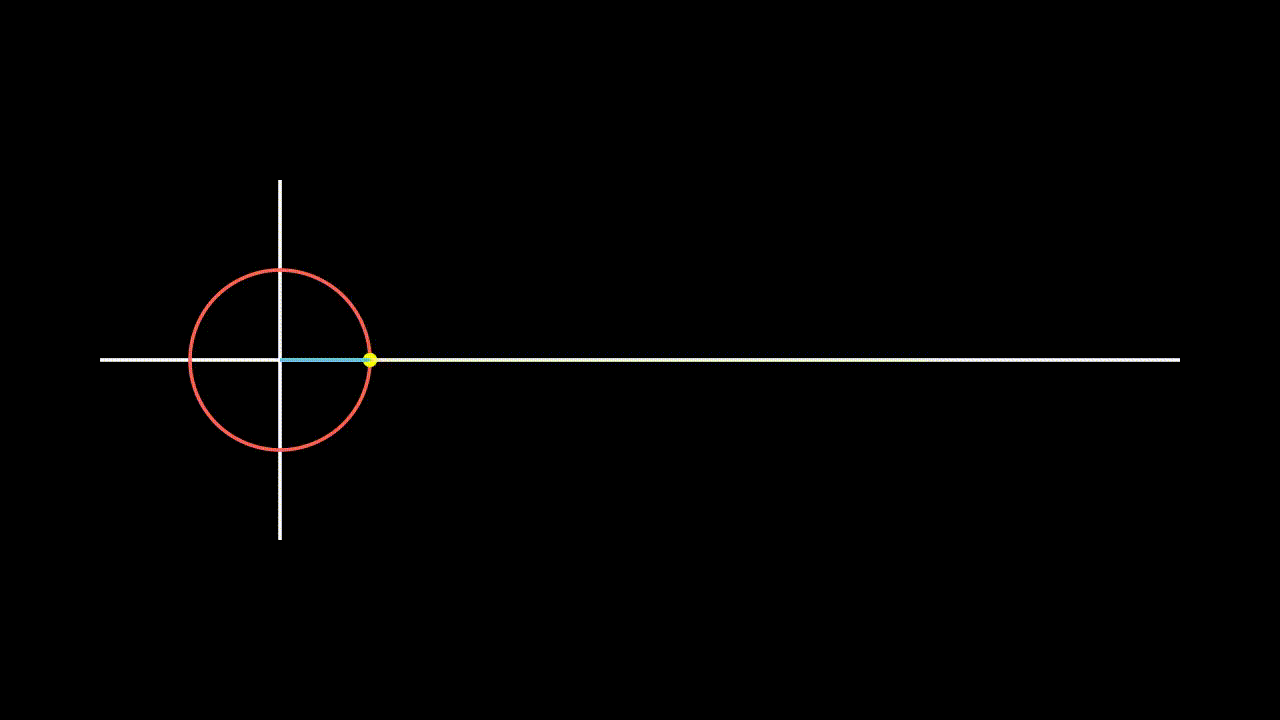
1. 축 라인과 원을 그린다.
가로축과 세로축, 그리고 원이 놓이게 되는 좌표를 구상하자.

위 그림을 코드로 짠다.
클래스 이름은 LongSineCurve로 하자.
class LongSineCurve(Scene):
	def construct(self):
        self.show_axis()
        self.show_circle_dot()

        self.wait()

    def show_axis(self):
        self.x_start = np.array([-6,0,0])
        x_axis = Line(self.x_start, np.array([6, 0, 0]))
        y_axis = Line(np.array([-4, -2, 0]), np.array([-4, 2, 0]))

        self.add(x_axis, y_axis)

        self.origin_point = np.array([-4, 0, 0])
        self.curve_start = np.array([-3, 0, 0])

        self.one_cycle_length = 2 * PI
        self.curve_end = np.array([self.curve_start[0] + self.one_cycle_length, 0, 0])

    def show_circle_dot(self):
        circle = Circle(radius=1)
        circle.move_to(self.origin_point)

        dot = Dot(radius=0.08, color=YELLOW)
        dot.move_to(circle.point_from_proportion(0))

        self.add(circle, dot)
        self.circle = circle
        self.dot = dot
여기까지 실행되는 모습은,

2. 점, 막대, 라인을 그리는 애니메이션 만든다.
기본 전략은,
- 시간의 흐름에 따라 점(dot)을 원둘레로 돌게 하고: 4초에 한 바퀴
- 점(dot)이 이동함에 따라, 원점에서 점까지의 라인이 자동 그려지게 하고, 또한 점에서 그래프의 끝에까지의 직선이 그려지게 한다.
점을 시간의 흐름에 따라 자동으로 이동하게 하는 것은, dot.add_updater(go_around_circle)에 의해 이루어지게 한다.
        self.t_offset=0
        rate = 0.25
        def go_around_circle(mob, dt):
            self.t_offset += dt
            # print(self.t_offset)
            mob.move_to(self.circle.point_from_proportion((self.t_offset * rate) % 1))

        dot.add_updater(go_around_circle)
go_around_circle 함수의 파라미터에 있는 dt 값은 프레임 시간이다. 1초에 30 프레임이면 1/30이다.
따라서, self.t_offset += dt를 하게 되면 self.t_offset 변수는 실제 시간 값을 가지게 되고, 프레임이 바뀔 때마다 그 값이 경신되게 된다.
go_around_circle의 파라미터로 있는 mob는 add_updater를 호출한 객체 자신이되기에, mob는 dot이다.
따라서, mob.move_to를 한 것은 dot.move_to를 한 것과 동일하다.
dot를 원둘레의 어떤 위치로 이동시키는데, point_from_proportion을 사용했다. 이 함수는 원 전체 둘레를 0~1까지의 값으로 보고, 주어진 값에 해당하는 원둘레 위치 값을 리턴한다. 예를 들어 circle.point_from_proportion(0.5)를 하게 되면, 원둘레의 처음 시작점에서 시작해서 절반이 되는 지점의 위치 값이 리턴된다.
그렇다면 self.circle.point_from_proportion((self.t_offset * rate) % 1) 은 어떤 의미일까?
self.t_offset은 실제 진행되는 시간에 대한 초(second) 값으로 계산되도록 해놨다. 따라서, 1초가 지났다면 self.t_offset =1이고, 여기에 rate=0.25를 곱하게 되면 0.25가 된다.
1초가 지났을 때는 원둘레의 1/4(=0.25)되는 지점을 가리키고, 2초라면 1/2 지점, 4초가 지나면 원을 한 바퀴 돌아서 출발점으로 돌아온다. 즉, 4초마다 원을 한 바퀴 돌게 하는 코드이다.
이제 점을 이동하게는 해 놨고, 이 점을 기준 포인트로 해서, 점의 움직임에 따라 원의 중심에서 점까지의 라인, 그리고 점에서 그래프의 끝까지의 라인을 그려보자.
        def get_line_to_circle():
            return Line(orgin_point, dot.get_center(), color=BLUE)

        def get_line_to_curve():
            x = self.curve_end[0]  # fixing to the end of the curve
            y = dot.get_center()[1]
            return Line(dot.get_center(), np.array([x,y,0]), color=YELLOW_A, stroke_width=2 )


	origin_to_circle_line = always_redraw(get_line_to_circle)
        dot_to_curve_line = always_redraw(get_line_to_curve)
원의 중심에서 점(dot)까지의 라인은, Line(orgin_point, dot.get_center())처럼 간단히 구현 가능.
점(dot)에서 사인 그래프의 끝 점까지의 라인은, 사인 그래프의 끝 점만 알아내면 되는데, 여기서는 끝 점이 되는 x 위치를 고정해 놨기에 그 고정값으로 지정하고, y 값은 점의 높이값으로 해버리면 됨 (사인 값이니깐 원 막대의 높이값에 해당)
그래프의 끝 점은 show_axis 함수에서 고정해 놨음
self.curve_end = np.array([self.curve_start[0] + self.one_cycle_length, 0, 0])
여기까지의 코드는,
class LongSineCurve(Scene):
    def construct(self):
        self.show_axis()
        self.show_circle_dot()
        self.draw_several_cycle()

        self.wait()

    def show_axis(self):
        self.x_start = np.array([-6,0,0])
        x_axis = Line(self.x_start, np.array([6, 0, 0]))
        y_axis = Line(np.array([-4, -2, 0]), np.array([-4, 2, 0]))

        self.add(x_axis, y_axis)

        self.origin_point = np.array([-4, 0, 0])
        self.curve_start = np.array([-3, 0, 0])

        self.one_cycle_length = 2 * PI
        self.curve_end = np.array([self.curve_start[0] + self.one_cycle_length, 0, 0])

    def show_circle_dot(self):
        circle = Circle(radius=1)
        circle.move_to(self.origin_point)

        dot = Dot(radius=0.08, color=YELLOW)
        dot.move_to(circle.point_from_proportion(0))

        self.add(circle, dot)
        self.circle = circle
        self.dot = dot

    def draw_several_cycle(self):
        dot = self.dot
        orgin_point = self.origin_point

        self.t_offset = 0
        rate = 0.25
        one_cycle_time= (1 / rate) + (1/self.camera.frame_rate) * rate

        def go_around_circle(mob, dt):
            self.t_offset += dt
            # print(self.t_offset)
            mob.move_to(self.circle.point_from_proportion((self.t_offset * rate) % 1))

        def get_line_to_circle():
            return Line(orgin_point, dot.get_center(), color=BLUE)

        def get_line_to_curve():
            x = self.curve_end[0]  # fixing to the end of the curve
            y = dot.get_center()[1]
            return Line(dot.get_center(), np.array([x,y,0]), color=YELLOW_A, stroke_width=2 )

        dot.add_updater(go_around_circle)

        origin_to_circle_line = always_redraw(get_line_to_circle)
        dot_to_curve_line = always_redraw(get_line_to_curve)

        self.add(origin_to_circle_line, dot_to_curve_line)
        self.wait(one_cycle_time*4)

        dot.remove_updater(go_around_circle)
여기까지 코드에 대한 실행은,
3. 사인 그래프를 그리자.
먼저, 위상 차이값 dx가 주어지면, 이에 해당하는 사인 그래프를 토해내는 함수를 만든다.
즉, $\sin (x + dx)$는 $\sin x$의 그래프가 왼쪽으로 dx만큼 이동한 것
        def get_sine_curve(dx=0):
            return FunctionGraph(
                lambda x: np.sin(x-self.curve_start[0]+dx),
                x_min=self.x_start[0], x_max=self.curve_end[0],
            )
위 코드의 lambda 함수에서 np.sin(x+dx)가 아닌 np.sin(x-self.curve_start[x]+dx)라고 한 것은, x=self.curve_start[0]에서의 사인 그래프의 값이 0이 되도록 하게 함이다. 즉, x=self.x_start[0]=-6에서 self.curve_end[0]=-6 + 2 $ \pi$까지의 값인데, x가 self.curve_start[0]=-3에서 이 되게 하려면 np.sin(x-self.curve_start[0])이라고 해야 한다.
여기서 self.x_start 및 self.curve_end 등은 show_axis 함수에 정의되어 있다.
사인 함수가 self.curve_start[0]에서 0인 값을 가진다는 것은, 사인 그래프가 아래 그램과 같은 모양이 되길 원하는 것이다.

...
x_min=self.x_start[0]까지 한 것은, 사인 그래프의 왼쪽 끝 점을 self.x_start[0]=-6까지 한 것으로, 아래 그림과 같이, 사인 함수의 시작점보다 더 왼쪽까지 그려서, 사인 그래프의 이동되는 모습을 더 자연스럽게 보이게 하기 위함이다.

...
이제, 사인 그래프가 자동으로 그려지게 하는 것은 always_redraw를 이용해서 수행되게 한다.
        def get_sine_curve(dx=0):
            return FunctionGraph(
                lambda x: np.sin(x-self.curve_start[0]+dx),
                x_min=self.x_start[0], x_max=self.curve_end[0],
            )

        def get_updated_sine_curve():
            return get_sine_curve(dx=self.t_offset * ( PI / 2))

       sine_curve = always_redraw(get_updated_sine_curve)
get_updated_sine_curve 함수에서는 페이즈 값 dx=self.t_offset * (PI / 2)를 가지고 get_sine_curve 함수를 호출해서 얻어낸 사인 그래프를, 계속해서 업데이트한다. 그럼으로써 사인 그래프가 왼쪽으로 이동되는 모습을 애니메이션 할 수 있다.
페이즈 값(위상 차 값)을 self.t_offset * (PI / 2)로 지정한 것을 생각해보자.
self.t_offset 값은 실제 시간을 나타내고, 사인 그래프는 4초를 한 주기가 되도록 세팅되었기에(go_around_circle 함수에서 그렇게 되도록 세팅했다), dx 값은 4초에 한 주기가 돌도록 세팅되어야 한다.
좀 더 이해하기 쉽도록 t_offset값과 dx 값을 테이블로 나타내 보면,
| time | 0초 ... | 1초 ... | 2초 ... | 3초 ... | 4초 ... |
| t=t_offset | 0 ... | 1 ... | 2 ... | 3 ... | 4 ... |
| dx | 0 ... | 0.25 ... | 0.5 ... | 0.75 ... | 1 ... |
| x 값 | 0 | $\frac {\pi} {2}$ | $\pi$ | $\frac {3 \pi} {2}$ | 2 $\pi$ |
즉, dx 값을 비례식으로 구하면,
$$4 : 2 \pi = t : x $$
$$ x = \frac {2 \pi t} {4} = \frac {\pi t} {2}$$
...
이제 전체 코드가 완성되었다.
from manimlib.imports import *

class LongSineCurve(Scene):
    def construct(self):
        self.show_axis()
        self.show_circle_dot()
        self.draw_several_cycle()

        self.wait()

    def show_axis(self):
        self.x_start = np.array([-6,0,0])
        x_axis = Line(self.x_start, np.array([6, 0, 0]))
        y_axis = Line(np.array([-4, -2, 0]), np.array([-4, 2, 0]))

        self.add(x_axis, y_axis)

        self.origin_point = np.array([-4, 0, 0])
        self.curve_start = np.array([-3, 0, 0])

        self.one_cycle_length = 2 * PI
        self.curve_end = np.array([self.curve_start[0] + self.one_cycle_length, 0, 0])

    def show_circle_dot(self):
        circle = Circle(radius=1)
        circle.move_to(self.origin_point)

        dot = Dot(radius=0.08, color=YELLOW)
        dot.move_to(circle.point_from_proportion(0))

        self.add(circle, dot)
        self.circle = circle
        self.dot = dot
    def draw_several_cycle(self):
        dot = self.dot
        orgin_point = self.origin_point

        self.t_offset = 0
        rate = 0.25
        one_cycle_time= (1 / rate) + (1/self.camera.frame_rate) * rate

        def go_around_circle(mob, dt):
            self.t_offset += dt
            # print(self.t_offset)
            mob.move_to(self.circle.point_from_proportion((self.t_offset * rate) % 1))

        def get_line_to_circle():
            return Line(orgin_point, dot.get_center(), color=BLUE)

        def get_line_to_curve():
            x = self.curve_end[0]  # fixing to the end of the curve
            y = dot.get_center()[1]
            return Line(dot.get_center(), np.array([x,y,0]), color=YELLOW_A, stroke_width=2 )

        def get_sine_curve(dx=0):
            return FunctionGraph(
                lambda x: np.sin(x-self.curve_start[0]+dx),
                x_min=self.x_start[0], x_max=self.curve_end[0],
            )

        def get_updated_sine_curve():
            return get_sine_curve(dx=self.t_offset * ( PI / 2))


        dot.add_updater(go_around_circle)


        origin_to_circle_line = always_redraw(get_line_to_circle)
        dot_to_curve_line = always_redraw(get_line_to_curve)

        sine_curve = always_redraw(get_updated_sine_curve)

        self.add(origin_to_circle_line, dot_to_curve_line, sine_curve)
        self.wait(one_cycle_time*4)

        dot.remove_updater(go_around_circle)
실행 동영상은,
동영상 서비스가 종료되어 해당 콘텐츠를 재생할 수 없습니다.
-끝-
'Programming > Manim Project' 카테고리의 다른 글
| 사인 파의 진폭을 변형시키면서 사인파 이동시키기 (0) | 2020.09.17 |
|---|---|
| 흐르는 물결같은, 흐르는 사인 곡선 만들기 (0) | 2020.09.17 |
| 원 위의 점이 돌면서 사인/코사인 곡선 그리기 (0) | 2020.09.15 |
| 원 위의 점이 이동하면서 사인 곡선 그리기 (1) | 2020.09.14 |
| python의 for 루프 설명하기 (0) | 2020.05.31 |


