하려는 것
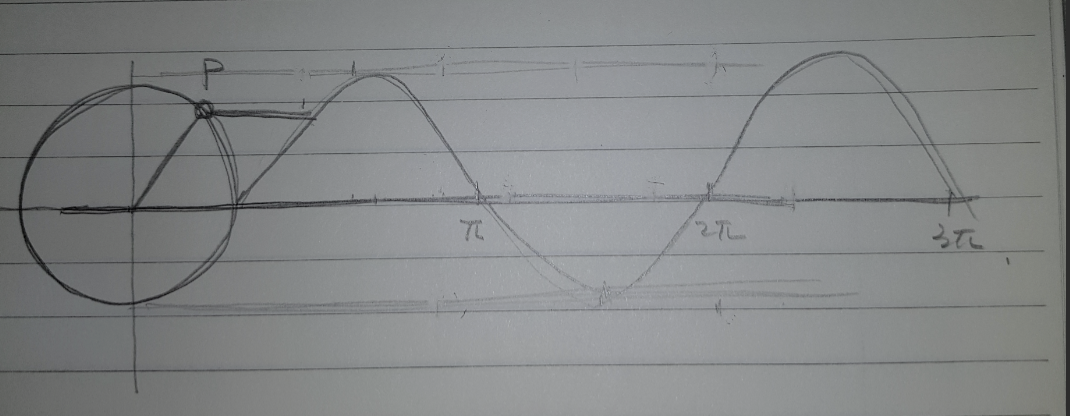
사인(sine)이나 코사인(cosine) 함수의 그래프가 아래와 같이 된다는 것을, 기하학적인 삼각함수의 기본 원리를 가지고 보여주는 애니메이션을 만들고자 한다.
<그림>
사인 그래프를 예를 들면, 반지름의 길이가 1인 원을 그리고, 그 원둘레의 한 점 P를 잡아서, 원점에서 그 점까지의 직선을 그리고, x축과 그 직선의 사잇각을 $ \theta $라 하자.
그렇다면 $ \sin \theta $는 점 P에서 x축으로 수직으로 내린 길이가 된다. 왜냐면, $ \sin \theta = 높이/빗변$ 이기 때문. 그리고, 점 P의 높이라는 것은, 점 P의 y축 좌표값이다. 즉, $ \sin \theta = {P_y}$

$ \theta $ 값이 0(zero)이 될 때의 P는 원의 오른편 둘레가 x축과 만나는 점이고, P를 원둘레를 따라 반시계 방향으로 점점 이동시키면, $ \theta $가 점점 커지게 된다.
이렇게 $ \theta $를 점점 커지게 할 때, $ \sin \theta $의 값을 생각해보면, $ \sin \theta = {P_y}$이기에, $ \theta = 0 $에서 0이었다가, $ \theta $가 커짐에 따라 조금씩 커지다가 $ \theta = 90도$일 때 $ \sin \theta = 1$로 가장 큰 값을 가지고, 그 이후 작아지게 된다.
이렇게 원 상의 P를 이동시키면서 오른편에 그 P의 y축 값을 그려나가면, 이것이 사인 그래프가 될 것이고, 여기서 하려는 바가 이러한 시뮬레이션을 보여주는 것이다.
스케치
왼쪽 편에 원을 그리고, 그 오른편으로 사인 그래프가 그려지게 한다.

코딩
1. 축 그리기
고려할 것은, x축과 y축의 길이, 그리고 원 크기
- x축: -6 ~ 6
- y축: -4 ~ 4
- 원의 반지름: 1
- 원 중심: [-4,0]

x축과 y축을 Line을 이용해서 생성하고, 원의 중점과 x축과 원이 만나는 오른편은 다른 함수에서도 사용할 수 있도록 전역 변수로 잡자.
    def show_axis(self):
        x_start = np.array([-6,0,0])
        x_end = np.array([6,0,0])

        y_start = np.array([-4,-3,0])
        y_end = np.array([-4,3,0])

        x_axis = Line(x_start, x_end)
        y_axis = Line(y_start, y_end)

        self.add(x_axis, y_axis)

        self.orgin_point = np.array([-4,0,0])
        self.curve_start = np.array([-3,0,0])
2. 원 그리기
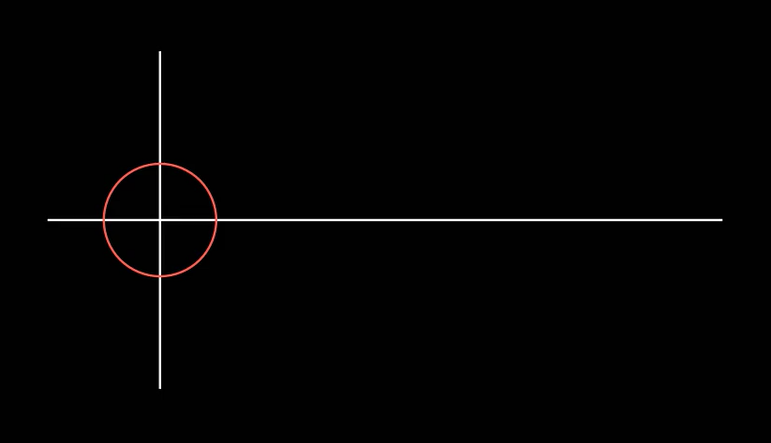
원의 반지름은 1로 하기로 했고, 그 중심은 위의 축 그리기에서 약속한 self.orgin_point이다.
그리고, 다른 함수에서 이 원을 사용할 것이기에 전역 변수로 지정한다.
    def show_circle(self):
        circle = Circle(radius=1)
        circle.move_to(self.orgin_point)

        self.add(circle)
        self.circle = circle
여기까지 코딩해서 실행해보면 다음과 같을 것이다.
    def construct(self):
        self.show_axis()
        self.show_circle()

        self.wait()

여기까지의 소스 파일
from manimlib.imports import *

class Sine_Curve(Scene):
    def construct(self):
        self.show_axis()
        self.show_circle()

        self.wait()

    def show_circle(self):
        circle = Circle(radius=1)
        circle.move_to(self.orgin_point)

        self.add(circle)
        self.circle = circle

    def show_axis(self):
        x_start = np.array([-6,0,0])
        x_end = np.array([6,0,0])

        y_start = np.array([-4,-3,0])
        y_end = np.array([-4,3,0])

        x_axis = Line(x_start, x_end)
        y_axis = Line(y_start, y_end)

        self.add(x_axis, y_axis)

        self.orgin_point = np.array([-4,0,0])
        self.curve_start = np.array([-3,0,0])
        # self.wait()
3. 원 주위를 점이 돌면서 사인 그래프 그리기
핵심 되는 코드이다.
아래와 같이 구상해보자.
- 원 주위를 점(dot)이 돈다. --> dot.add_updater 함수를 이용해서 자동으로 점이 원 주위를 돌게 한다.
- dot가 움직임에 따라서,
1) 원점에서 dot까지의 직선이 새롭게 그려지게 한다. --> always_redraw 이용
2) dot에서 사인 커브까지의 직선이 새롭게 그려지게 한다. --> always_redraw 이용
3) 사인 커브가 새롭게 그려지게 한다. --> always_redraw 이용
...
먼저 점이 원 주위를 도는 코드를 작성해보자
dot.add_update(go_around_circle)이라고 지정해서, 동영상 프레임이 변할 때마다 go_around_circle 함수 내에서 dot의 위치가 변하도록 한다.
point_from_proportion 함수를 이용하면, 원둘레를 1로 봤을 때, 0~1까지의 값을 지정하면, 원둘레의 해당 지점을 알 수 있다. 그리고, 그 지점으로 dot를 이동시키면 되는 것
mob.move_to(orbit.point_from_proportion(self.t_offset % 1))
위 코드에서 mob는 dot가 되고, orbit는 circle이다.
여기서 문제는 시간이 흐름에 따라 self.t_offset 값이 변하게 해야 하는데, add_update의 인자로 'dt'를 지정해서 사용하면 된다.
go_around_circle 함수의 파라미터로 'dt'를 지정하게 되면, 이 dt는 프레임마다의 시작 시간을 가리키게 되기에, 이를 이용하면 dot가 프레임이 진행될 때마다 원 주위를 돌 수 있게 할 수 있다.
만약 1초에 15 프레임짜리 동영상으로 인코딩이 된다면, dt는 1/15초씩 증가하게 되고, 1초 뒤에는 15/15=1이 되고, 2초 뒤에는 2가 된다.
따라서, 1초에 원 한 바퀴를 돌게 하고자 한다면 다음과 같이 하면 된다.
       def go_around_circle(mob, dt):
            self.t_offset += dt
            mob.move_to(orbit.point_from_proportion(self.t_offset % 1))
만약 1초에 반 바퀴, 즉 2초에 한 바퀴가 돌게 하려면, t_offset 값에 0.5를 곱해서 작아지게 하면 된다.
4초에 한 바퀴가 돌게 하려면 0.25를 곱하면 되겠다.
        rate = 0.25

        def go_around_circle(mob, dt):
            self.t_offset += (dt * rate)
            mob.move_to(orbit.point_from_proportion(self.t_offset % 1))
여기까지 하면, 축과 원을 그리고, 점 하나가 원 주위를 4초에 한 번씩 도는 코드가 완성된다.
from manimlib.imports import *

class Sine_Curve(Scene):
    def construct(self):
        self.show_axis()
        self.show_circle()
        self.move_dot_and_draw_curve()

        self.wait()

    def show_axis(self):
        x_start = np.array([-6,0,0])
        x_end = np.array([6,0,0])

        y_start = np.array([-4,-3,0])
        y_end = np.array([-4,3,0])

        x_axis = Line(x_start, x_end)
        y_axis = Line(y_start, y_end)

        self.add(x_axis, y_axis)

        self.orgin_point = np.array([-4,0,0])
        self.curve_start = np.array([-3,0,0])

    def show_circle(self):
        circle = Circle(radius=1)
        circle.move_to(self.orgin_point)

        self.add(circle)
        self.circle = circle

    def move_dot_and_draw_curve(self):
        orbit = self.circle
        orgin_point = self.orgin_point

        dot = Dot(radius=0.08, color=GREEN)
        dot.move_to(orbit.point_from_proportion(0))
        self.t_offset = 0
        rate = 0.25

        def go_around_circle(mob, dt):
            self.t_offset += (dt * rate)
            # print(self.t_offset)
            mob.move_to(orbit.point_from_proportion(self.t_offset % 1))

        dot.add_updater(go_around_circle)
        self.add(dot)
        self.wait(8.5)

        dot.remove_updater(go_around_circle)
이제 원 주위를 점이 자동으로 움직이게는 했고, 이 점의 움직임을 기준으로 해서 1) 원점에서 점까지의 직선 2) 점에서 그래프까지의 직선 3) 사인 그래프가 자동으로 그려지게 해야 한다.
원점에서 점까지의 직선
origin_to_circle_line에 대해서 always_redraw(get_line_to_circle)이라고 지정을 해서, get_line_to_circle에 의해 프레임이 변할 때마다 새롭게 Line이 생성되게 한다.
origin_to_circle_line = always_redraw(get_line_to_circle)
get_line_to_circle 함수에서는 원의 중심에서 dot의 중심으로의 라인을 생성해서 리턴한다. 이때 dot의 위치는 계속해서 변하기에, 이 변하는 dot의 위치로 Line이 계속해서 만들어질 것이다.
        def get_line_to_circle():
            return Line(orgin_point, dot.get_center(), color=BLUE)

		origin_to_circle_line = always_redraw(get_line_to_circle)
점에서 그래프까지의 직선
dot_to_curve_line이라는 변수를 always_redraw(get_line_to_curve)에 의해 만들어지게 한다.
get_line_to_curve 함수에서 새롭게 Line이 만들어지는데, 이 라인의 시작점은 점(dot)의 중심이고, 해당 점에 대한 사인 그래프상의 위치가 된다.
라인의 끝 점에 대해 다시 생각해보면, 그 점의 y좌표는 점의 y좌표값과 같고(왜냐면 점에서 오르 편으로 쭈욱 그은 직선상에 위치하니깐), x좌표는 점(dot)이 이동함에 따라 조금씩 x축의 오른편으로 이동하면 된다.
앞부분에서, 동영상 프레임이 진행됨에 따라 커지는 값으로 self.t_offset을 정의해 놨기에, 이 값을 사용하면 되겠다.
self.t_offset은 dot가 원 주위를 한 바퀴 돌면 1이 되고, 1.5바퀴 돌면 1.5가 된다.
원을 한 바퀴 돈다는 것은 360도이고 라디안 값으로 $ 2 \pi $이다.
그렇다면, 원이 한 바퀴 돌 때의 $ 2 \pi $ 만큼의 x 축 길이를 4가 되게 하자. 그렇게 하게 되면 두 바퀴를 돌면 8 만큼의 길이가 될 것이기에 x 축의 전체 길이를 고려했을 때 적당할 것이다. (위에서, x축은 -6~6까지로, 길이 12짜리로 설정했었다.)
위와 같은 로직을 코딩하면, get_line_to_curve 함수는 다음과 같이 된다.
x의 위치가, 사인 커브가 시작되는 위치에서 t_offset을 4배 한 위치만큼 더한 값으로 되는 것에 유의.
        def get_line_to_curve():
            x = self.curve_start[0] + self.t_offset * 4
            y = dot.get_center()[1]
            return Line(dot.get_center(), np.array([x,y,0]), color=YELLOW )

        dot_to_curve_line = always_redraw(get_line_to_curve)
사인 그래프 그리기
dot가 이동함에 따라 사인 그래프를 그려야 한다.
사인 그래프를, 여러 자그마한 직선들을 붙이고 붙이고 해서 만들 것이다.
가장 첫 번째 직선은 사인 커브가 시작되는 점에서 시작될 것이고, dot가 처음 위치에서 조금씩 원둘레를 이동할 때마다 새로운 직선들이 생겨서 추가되는 형태
        self.curve = VGroup()
        self.curve.add(Line(self.curve_start,self.curve_start))
        def get_curve():
            last_line = self.curve[-1]

            x = self.curve_start[0] + self.t_offset * 4
            y = dot.get_center()[1]
            new_line = Line(last_line.get_end(),np.array([x,y,0]) )

            self.curve.add(new_line)

            return self.curve
위 코드를 보면, 여러 직선들을 모아 두는 것으로 curve라는 VGroup 객체를 선언하고, 이 curve에 직선들을 하나씩 집어넣고 있다.
여기까지 코딩을 하게 되면, 원하는 바 대로의 동영상이 나온다.
from manimlib.imports import *

class Sine_Curve(Scene):
    def construct(self):
        self.show_axis()
        self.show_circle()
        self.move_dot_and_draw_curve()

        self.wait()

    def show_axis(self):
        x_start = np.array([-6,0,0])
        x_end = np.array([6,0,0])

        y_start = np.array([-4,-3,0])
        y_end = np.array([-4,3,0])

        x_axis = Line(x_start, x_end)
        y_axis = Line(y_start, y_end)

        self.add(x_axis, y_axis)

        self.orgin_point = np.array([-4,0,0])
        self.curve_start = np.array([-3,0,0])

    def show_circle(self):
        circle = Circle(radius=1)
        circle.move_to(self.orgin_point)

        self.add(circle)
        self.circle = circle

    def move_dot_and_draw_curve(self):
        orbit = self.circle
        orgin_point = self.orgin_point

        dot = Dot(radius=0.08, color=GREEN)
        dot.move_to(orbit.point_from_proportion(0))
        self.t_offset = 0
        rate = 0.25

        def go_around_circle(mob, dt):
            self.t_offset += (dt * rate)
            # print(self.t_offset)
            mob.move_to(orbit.point_from_proportion(self.t_offset % 1))

        def get_line_to_circle():
            return Line(orgin_point, dot.get_center(), color=BLUE)

        def get_line_to_curve():
            x = self.curve_start[0] + self.t_offset * 4
            y = dot.get_center()[1]
            return Line(dot.get_center(), np.array([x,y,0]), color=YELLOW )


        self.curve = VGroup()
        self.curve.add(Line(self.curve_start,self.curve_start))
        def get_curve():
            last_line = self.curve[-1]
            x = self.curve_start[0] + self.t_offset * 4
            y = dot.get_center()[1]
            new_line = Line(last_line.get_end(),np.array([x,y,0]) )
            self.curve.add(new_line)

            return self.curve

        dot.add_updater(go_around_circle)

        origin_to_circle_line = always_redraw(get_line_to_circle)
        dot_to_curve_line = always_redraw(get_line_to_curve)
        sine_curve_line = always_redraw(get_curve)

        self.add(dot)
        self.add(orbit, origin_to_circle_line, dot_to_curve_line, sine_curve_line)
        self.wait(8.5)

        dot.remove_updater(go_around_circle)
라인들 두껍기, 색깔, 그리고 x축에 눈금 표시 등을 해서 좀 더 보기 좋게 코드를 추가했다.
<최종 코드>
from manimlib.imports import *

class Sine_Curve(Scene):
    def construct(self):
        self.show_axis()
        self.show_circle()
        self.move_dot_and_draw_curve()

        self.wait()

    def show_axis(self):
        x_start = np.array([-6,0,0])
        x_end = np.array([6,0,0])

        y_start = np.array([-4,-2,0])
        y_end = np.array([-4,2,0])

        x_axis = Line(x_start, x_end)
        y_axis = Line(y_start, y_end)

        self.add(x_axis, y_axis)
        self.add_x_labels()

        self.orgin_point = np.array([-4,0,0])
        self.curve_start = np.array([-3,0,0])

    def add_x_labels(self):
        x_labels = [
            TexMobject("\pi"), TexMobject("2 \pi"),
            TexMobject("3 \pi"), TexMobject("4 \pi"),
        ]

        for i in range(len(x_labels)):
            x_labels[i].next_to(np.array([-1+2*i,0,0]), DOWN )
            self.add(x_labels[i])

    def show_circle(self):
        circle = Circle(radius=1)
        circle.move_to(self.orgin_point)

        self.add(circle)
        self.circle = circle

    def move_dot_and_draw_curve(self):
        orbit = self.circle
        orgin_point = self.orgin_point

        dot = Dot(radius=0.08, color=YELLOW)
        dot.move_to(orbit.point_from_proportion(0))
        self.t_offset = 0
        rate = 0.25

        def go_around_circle(mob, dt):
            self.t_offset += (dt * rate)
            # print(self.t_offset)
            mob.move_to(orbit.point_from_proportion(self.t_offset % 1))

        def get_line_to_circle():
            return Line(orgin_point, dot.get_center(), color=BLUE)

        def get_line_to_curve():
            x = self.curve_start[0] + self.t_offset * 4
            y = dot.get_center()[1]
            return Line(dot.get_center(), np.array([x,y,0]), color=YELLOW_A, stroke_width=2 )


        self.curve = VGroup()
        self.curve.add(Line(self.curve_start,self.curve_start))
        def get_curve():
            last_line = self.curve[-1]
            x = self.curve_start[0] + self.t_offset * 4
            y = dot.get_center()[1]
            new_line = Line(last_line.get_end(),np.array([x,y,0]), color=YELLOW_D)
            self.curve.add(new_line)

            return self.curve

        dot.add_updater(go_around_circle)

        origin_to_circle_line = always_redraw(get_line_to_circle)
        dot_to_curve_line = always_redraw(get_line_to_curve)
        sine_curve_line = always_redraw(get_curve)

        self.add(dot)
        self.add(orbit, origin_to_circle_line, dot_to_curve_line, sine_curve_line)
        self.wait(8.5)

        dot.remove_updater(go_around_circle)
실행 모습은 다음과 같다.
[컴파일 명령]
C:\dev\Python37\python.exe C:/dev/manim/manim.py src\sine_curve.py SineCurve -pm
-끝-
'Programming > Manim Project' 카테고리의 다른 글
| 흐르는 물결같은, 흐르는 사인 곡선 만들기 (0) | 2020.09.17 |
|---|---|
| 원 위의 점이 돌면서 사인/코사인 곡선 그리기 (0) | 2020.09.15 |
| python의 for 루프 설명하기 (0) | 2020.05.31 |
| [컴포넌트]VerticalBarChart 만들기 (3. 사용법) (0) | 2020.05.17 |
| [컴포넌트]VerticalBarChart 만들기 (2. 핵심코드 설명) (0) | 2020.05.16 |


