What we covered on the previous page was to use add_updater to specify a function to be executed for each frame, and to change the state value (position, color, etc.) of the object in this function. This allowed animations such as digital clocks to increase in number or to move along an elliptic curve.
This time, we will use the new method of drawing the object itself, not the state value of the object. Using the always_redraw method, this technique is necessary for animations such as drawing a new tangent line along the line of a graph or continuously creating points at a new location. In other words, it is not just changing the position or color of the object, but drawing the object itself.
manimlib.mobject.mobject_update_tuils.always_redraw(func)Whenever the frame changes, the current object is replaced with the object created using the given func.
Parameters: func
    Functions that create new object

Returns:
    Object changed to newly created objects
Looking at the internal code of always_redraw, it use add_updater.
mob.add_updater(lambda m: mob.become(func()))
In other words, changing the update function to animate an object is the same strategy as the previous ways, except that it is continuously changed to an object created by func using mob.become.
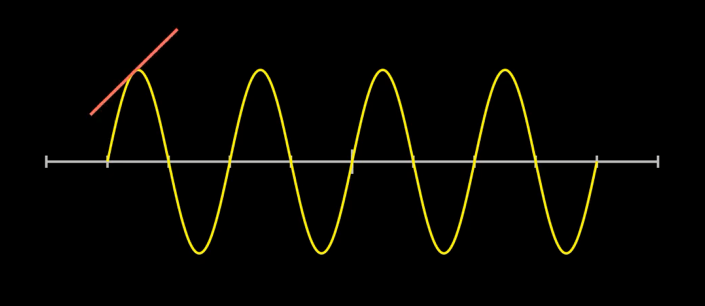
For a sine graph, let's create an animation that follows the graph and draws a tangent line at that point.
This is the coding strategy.
- Let's use Scene class even thoug GraphScene is more convenient.
- Create only x-axis as NumberLine, and sine graph as FunctionGraph
- Create a ValueTracker and set it to move along the x-axis.
- While following the value tracker's value, the x-axis value, continue to draw the tangent line at that x value with always_redraw method.
- The tangent line is calculated by dy/dx at each point.
    def draw_tangent(self):
        x_axis = NumberLine(x_min=-5,x_max=5)

        def sine_func(x):
            return 1.5 * np.sin(x * PI)

        graph = FunctionGraph(sine_func, x_min=-4, x_max=4)

        tracker = ValueTracker(-4)

        def get_tangent_line():
            line = Line(
                ORIGIN, 2 * RIGHT,
                color=RED,
                stroke_width=5,
            )
            dx = 0.0001

            x = tracker.get_value()
            p0 = np.array([x-dx,sine_func(x-dx),0])
            p1 = np.array([x, sine_func(x), 0])
            p2 = np.array([x + dx, sine_func(x + dx), 0])

            angle = angle_of_vector(p2 - p1)
            line.rotate(angle)
            line.move_to(p0)
            return line

        line = always_redraw(get_tangent_line)

        self.add(x_axis,graph,line)
        self.play(tracker.set_value, 4, rate_func=smooth, run_time=8)
        self.wait()
Most important part in the code is the get_tangent_line function that creates the tangent, and the part that calls this function through always_redraw.
The get_tangent_line function first creates a line by specifying its size/color/thickness, and then creates a tangent line by moving and rotating the line to be the tangent line at the desired x point.
1) Create a line
      line = Line(
              ORIGIN, 2 * RIGHT,
              color=RED,
              stroke_width=5,
          )
2) Set the position as the value of ValueTracker
x = tracker.get_value()
3) The slope at that position is calculated using the y/x equation where x is shifted by dx.
            dx = 0.0001

            x = tracker.get_value()
            p0 = np.array([x-dx,sine_func(x-dx),0])
            p1 = np.array([x, sine_func(x), 0])
            p2 = np.array([x + dx, sine_func(x + dx), 0])

            angle = angle_of_vector(p2 - p1)
4) The tangent line is created by rotating the line by the angle obtained above and moving it to the point on the graph corresponding to the current x value.
            line.rotate(angle)
            line.move_to(p0)
With always_redraw(get_tangent_line), the previous lines are continuously updated with new lines, which continues until the value of tracker.set_value is 4.
        line = always_redraw(get_tangent_line)

        self.add(x_axis,graph,line)
        self.play(tracker.set_value, 4, rate_func=smooth, run_time=8)
Example: always_redraw for graph
Let's make an animation that changes the shape of a 'graph' by always_redraw function.
The 'graph' is created by GraphScene.get_graph method.
The main code is,
        def func():
            return self.get_prior_graph(vt.get_value()/10)

        graph = always_redraw(func)
In the alway_redraw method, the object returned by the 'func' calls add_updater method. Therefore, we can also obtain the same effect using add_updater method instead of always_redraw method.
Below code use add_updater instead of always_redraw.
        def func(mob):
            graph2 = self.get_prior_graph(vt.get_value()/10)
            graph.become(graph2)
            return graph

        graph.add_updater(func)
The full sourec code for the example is below,
class GraphRedrawing(GraphScene):
    CONFIG = {
        "x_axis_label": "",
        "y_axis_label": "",
        "x_min": 0,
        "x_max": 15,

        "x_axis_width": 12,
        "y_min": 0,
        "y_max": 0.5,
        "y_axis_height": 6,
        "y_tick_frequency": 0.125,

        "graph_origin": 2.5 * DOWN + 5.5 * LEFT,
    }

    def construct(self):
        self.setup_axes()
        self.y_axis.add_numbers(
            0.25, 0.5, 0.75, 1,
            number_config={
                "num_decimal_places": 2,
            },
            direction=LEFT,
        )
        self.x_axis.add_numbers(*range(1, 15))

        graph = self.get_prior_graph(120/10)
        vt = ValueTracker(120)

        #1. use add_updater
        # def func(mob):
        #     graph2 = self.get_prior_graph(vt.get_value()/10)
        #     graph.become(graph2)
        #     return graph
        #
        # graph.add_updater(func)

        #2. use always_redraw
        def func():
            return self.get_prior_graph(vt.get_value()/10)

        graph = always_redraw(func)

        self.add(graph)
        self.play(vt.set_value, 20, run_time=6, rate_func=there_and_back)
        self.wait()

    def get_prior_graph(self, t=6):
        def prior(x):
            return ((x ** 3 / t) * np.exp(-x))

        return self.get_graph(prior)
We've looked at creating new objects and animating them using ValueTracker's changing values in always_redraw.
Instead of ValueTracker's changing values, we can also use other objects' changing values.
In the method using add_updater on the previous page, we saw examples of using ValueTracker, using variable values of other objects, and using dt values.
The key to using add_updater or always_redraw is to change the appearance of the current object by using some other variable value in the update function.
If there is a moving dot, and we want to display a text on it or draw a rectangle, we can do this,
- Create a function 'func' that creates an object (text or rectangle) using the coordinates of the point.
- After 'obj=always_redraw(lambda:func)' to make the object always created.
- Let this 'obj' appear on the screen,
- When animation is applied for moving dot, the above 'obj' is also created according to the moving point and animated.
Next: [06-3-C] Use Updating Class
[06-3-C] Use Updating Class
In the previous page, we looked at an animation technique that updates objects every frame using add_updater or always_redraw. These methods, Create some update_func that transforms tgt_mob. Regist..
infograph.tistory.com
Go To: [99] Table of Contents
'Programming > Manim Lectures' 카테고리의 다른 글
| [99] Table of Contents (0) | 2020.06.09 |
|---|---|
| [06-3-C] Use Updating Class (0) | 2020.06.09 |
| [06-3-A] Use add_updater (0) | 2020.06.09 |
| [06-3] Animation by Object Updating (0) | 2020.06.09 |
| [06-2] Animation by Object's Method (0) | 2020.06.09 |

